Cosmology View
My views on Cosmology and Physics
site navigation menu
Book by David Michalets
This is section 2 of 18.
The web page series for Distant Spectral Shifts is based on my book Cosmology Crisis Cleared.
I compiled data into a large data set to support this book's conclusions. To make sure this analysis was not skewed by a single source, two were used.
The book uses 2 references: Wikipedia or NASA/IPAC Extragalactic Database. Or NED. This reference site will be just NED in this book. Unfortunately, the 2 references do not agree in all galaxies.
Though there are many galaxies having an assigned NGC number, only those galaxies having defined celestial coordinates are listed. The galaxies are entered by increasing right ascension values in each constellation, which are in order by their sky quadrant.
Those galaxies having no velocity and distance values are sometimes omitted as they offer nothing to the analysis. Some were entered, though lacking those values, when their presence in the cluster's data contributes to the analysis of angular separation between consecutive galaxies within a cluster.
Galaxies are in order of quadrant, then increasing RA through each of the constellations in the quadrant.
2.1 Wikipedia Layout
Wikipedia has a general format for a galaxy's data. At the top of the page is general information. Sometimes, the data of interest, like distance, could be found here. Sometimes the value will match or disagree with its later value.
NGC 3226 is the example.
https://en.wikipedia.org/wiki/NGC_3226
Some galaxies will have an image to the right of the description.
The right side of the page will have the galaxy's celestial coordinates, at the top, or below the image.
Each galaxy will have Redshift data, as one or more velocities.
Many will have one or both of a z value or a km/s value. The km/s value must match z multiplied by 3E5 or else one or both is a mistake.
There can be a helio radial velocity; this is the one to use. NED also uses this term.
There can be a galactocentric velocity; this value is not for this analysis, so ignore it.
Below the velocities, there is usually a Distance. It will be stated in Mly, or Mpc or both. Since Hubble's constant uses Mpc so does the Data Set.
Next, there should be the visual magnitude, as Apparent magnitude (V). This is the value of interest for a luminosity. There could be other values, such as Absolute (A) or bolometric (B), but none are used in this analysis of redshifts.
Next are the galaxy Characteristics.
These include the Type. This is used for every galaxy.
Some references will have its size, stated as either a linear dimension in lightyears or parsecs, or as one or more angular dimensions, usually in moa, or minutes of arc, or arcminutes. Sometimes, arcseconds are used.
Some galaxies offer more data, such as an estimated mass, or star count but none of these are used in a redshift analysis. Some are probably based on assumptions with a distance and size.
2.2 NED Layout of galaxy data
The NASA/IPAC Extragalactic Database (NED) is funded by the National Aeronautics and Space Administration and operated by the California Institute of Technology. [Reference:
http://ned.ipac.caltech.edu/
The NASA/IPAC Extragalactic Database (NED) is funded by the National
Aeronautics and Space Administration and operated by the California Institute of Technology.
]
NED has a general format for a galaxy's data. At the top of the page is a series of tabs. Each title is followed by a number inside (), where the number indicates the number of items available after this selection.
Among the many, the relevant tabs are:
Redshifts,
Spectra,
Distances,
Redshifts should include the number of lines indicated, but only 2 are used:
V (heliocentric) has the value in km/s.
D (Local Group) has the value in Mpc.
The Wikipedia velocity and distance values should match NED, unless I used either when the sites were not synchronized.
The Spectra selection shows the number of spectra indicated by ().
Unfortunately, NED never explicitly identifies which specific spectrum was used for the stated redshift value in that tab's line.
2.3 NED Example with NGC 3226
Showing an example might make the descriptions clearer, because it has data available for its tabs.
Here is a sequence of screen captures. Links to the original images are not available because NED is interactive with no permanent links for transient pages of data. Most of the screen captures were done in April, 2021. If anything changed in NED after those captures then the images referenced could have missed a change. I expect NED adds new data, but rarely changes the archive.
2.3 Galaxy Example using NGC 3226
One reason for its selection as an example is its variety of spectra.
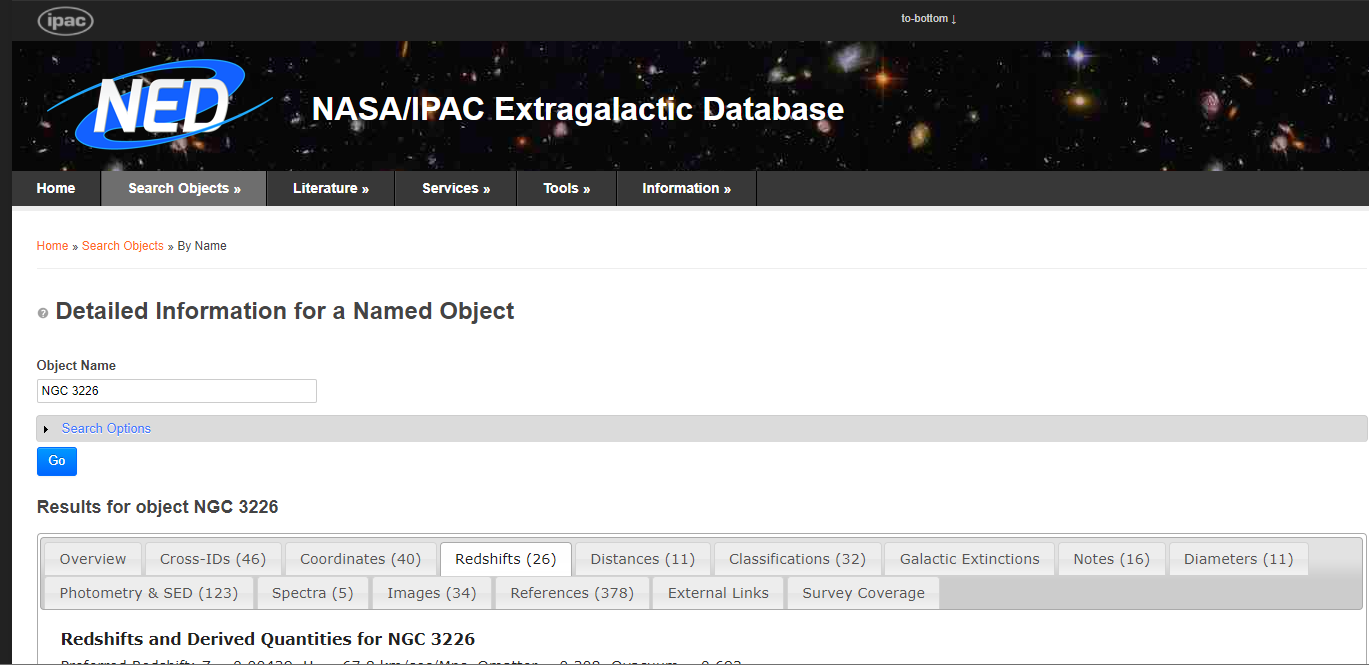
2.3.1 Image 1
click on link for image:
https://www.cosmologyview.com/NEDcap/NED-Overview-pics/NEDex1.png
NGC 3226 is entered in the box and the Go button is selected.
There is usually a delay between Go and the display of: Results for object, with the bar having the tab selections.
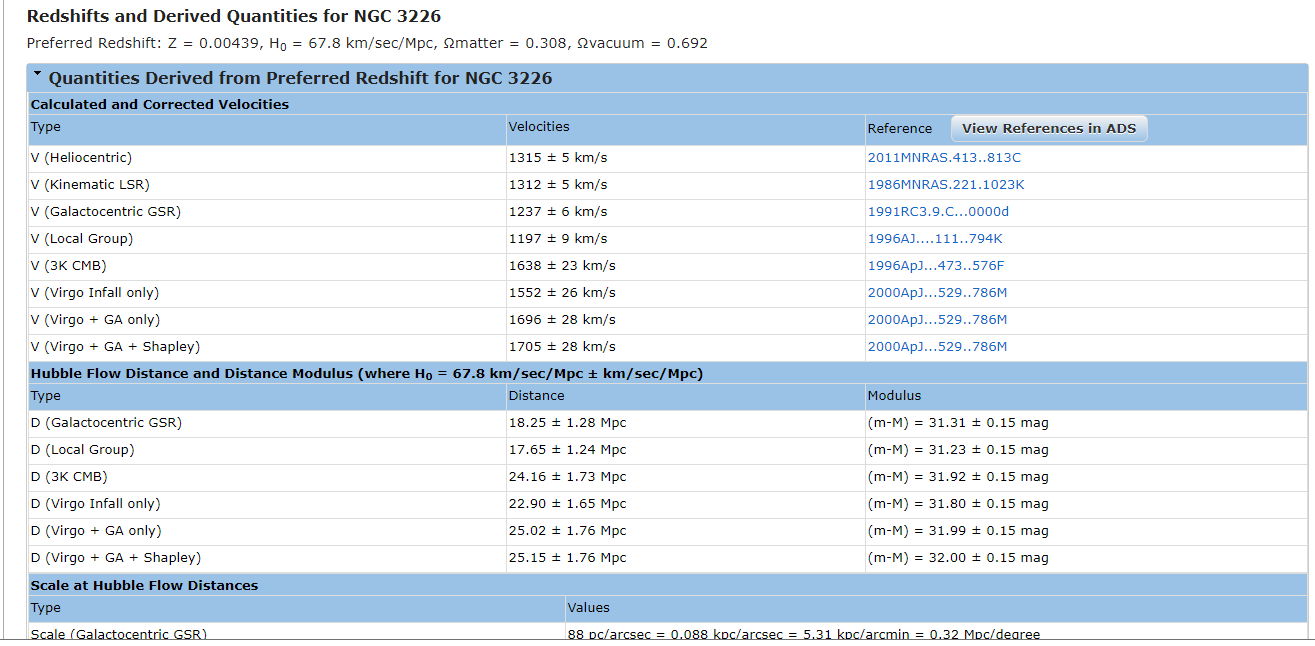
2.3.2 Image 2
https://www.cosmologyview.com/NEDcap/NED-Overview-pics/NEDex2.png
Selecting the Redshifts tab shows its data. The legend indicates 26 spectra for this galaxy.
.
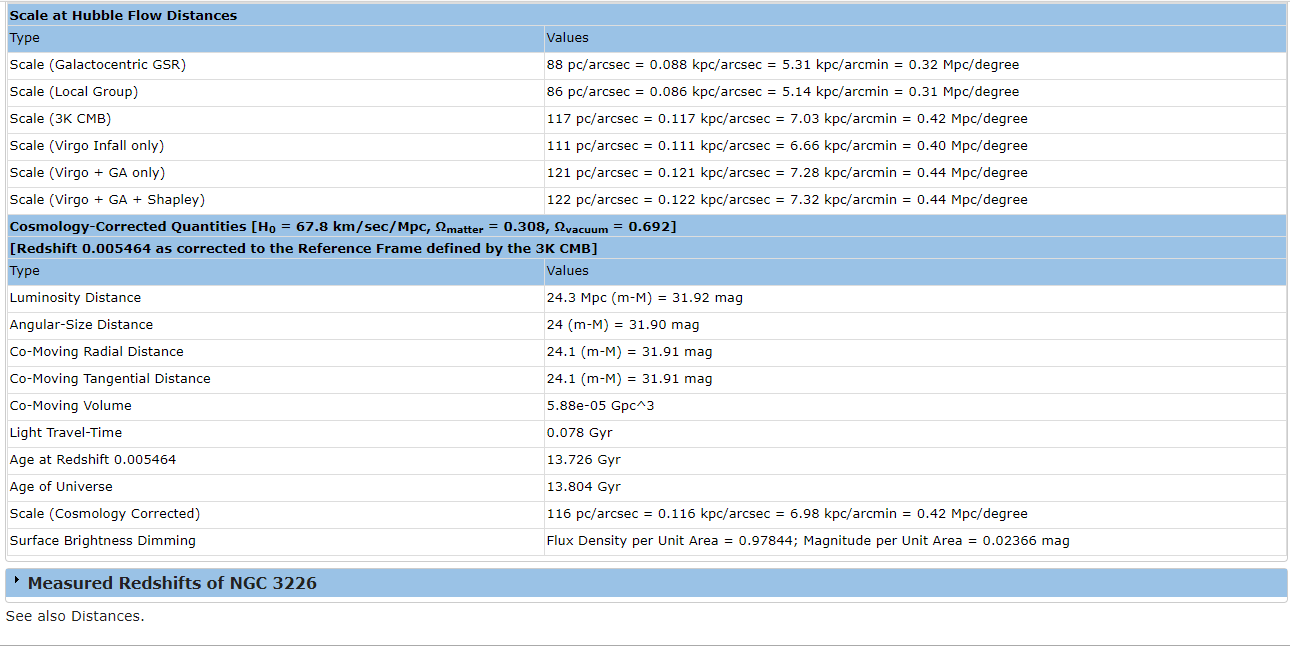
2.3.3 Image 3
click on link for image:
https://www.cosmologyview.com/NEDcap/NED-Overview-pics/NEDex3.png
The display is longer than this page. Here is more:
https://www.cosmologyview.com/NEDcap/NED-Overview-pics/NEDex3-excerpt.png
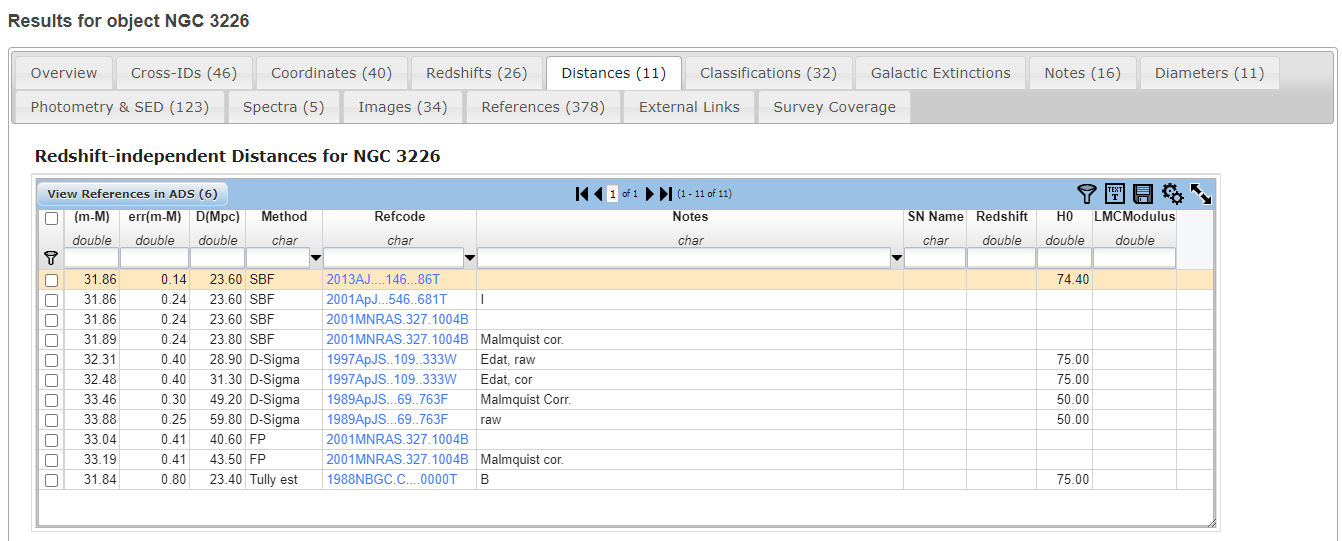
2.3.4 Image 4
click on link for image:
https://www.cosmologyview.com/NEDcap/NED-Overview-pics/NEDex4.png
Selecting the Distances tab shows its data. The legend indicates 11 items for this galaxy.
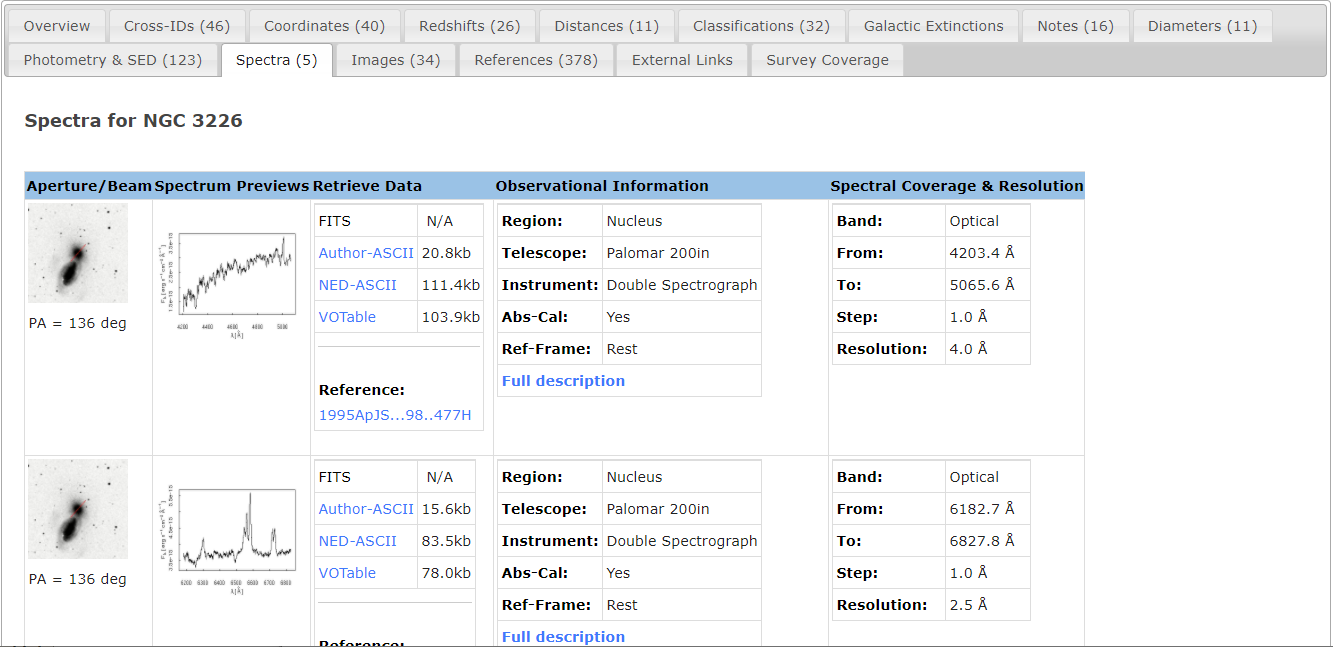
2.3.5 Image 5
click on link for image:
https://www.cosmologyview.com/NEDcap/NED-Overview-pics/NEDex5.png
Selecting the Spectra tab shows its data. The legend indicates 5 items for this galaxy.
click on link for image:
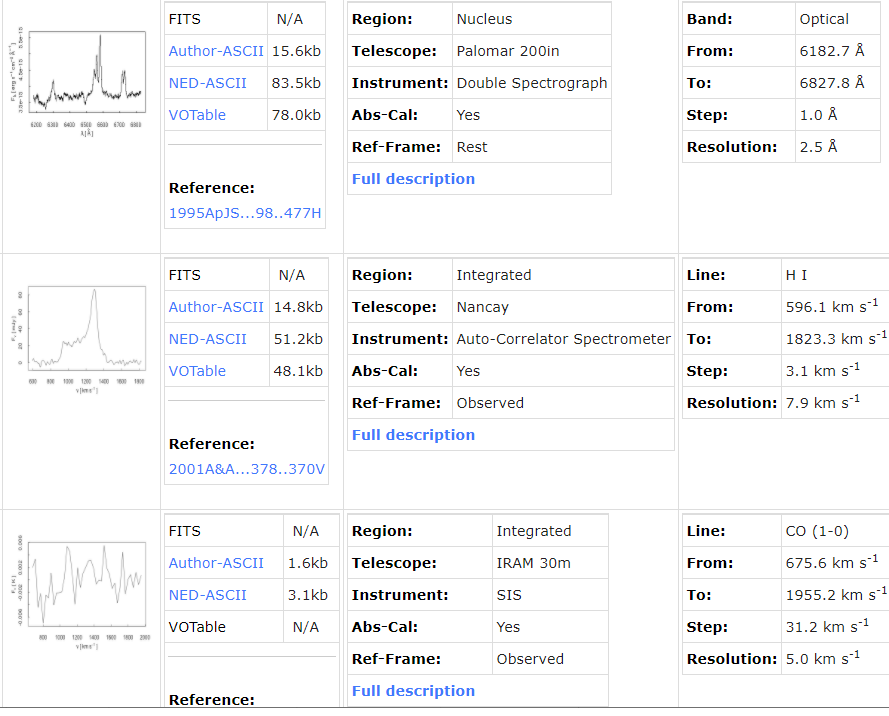
2.3.6 Image 6
The display is longer than this page. Here is more of the display (second Optical with others below it):
click on link for image:
https://www.cosmologyview.com/NEDcap/NED-Overview-pics/NEDex6.png
There is a second CO line spectrum, not in the capture.
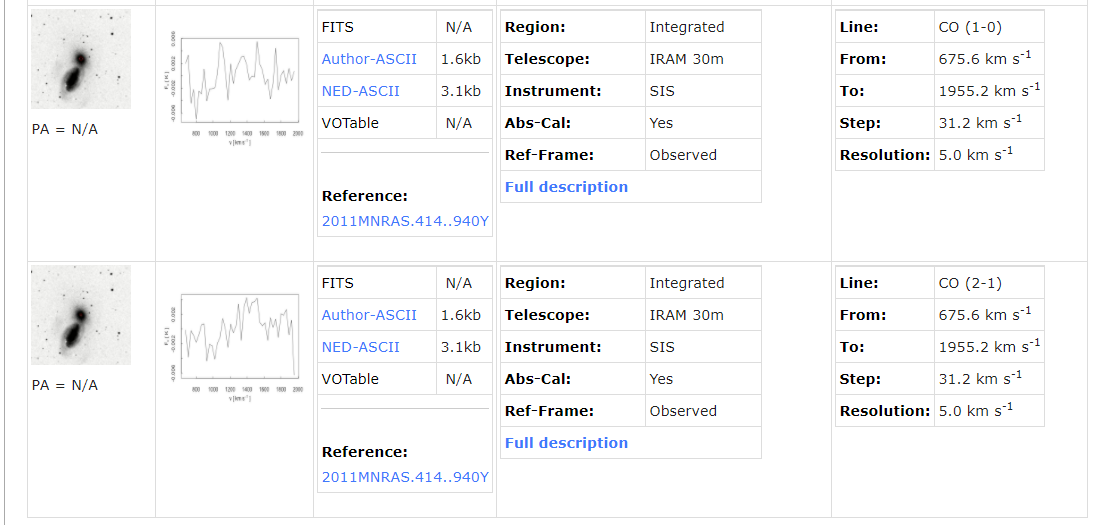
2.3.7 Image 7
click on link for image:
https://www.cosmologyview.com/NEDcap/NED-Overview-pics/NEDex7.png
The display is longer than this page. Here is more:
2.3.8 Image 8
click on link for image:
https://www.cosmologyview.com/NEDcap/NED-Overview-pics/NED-spec1.png
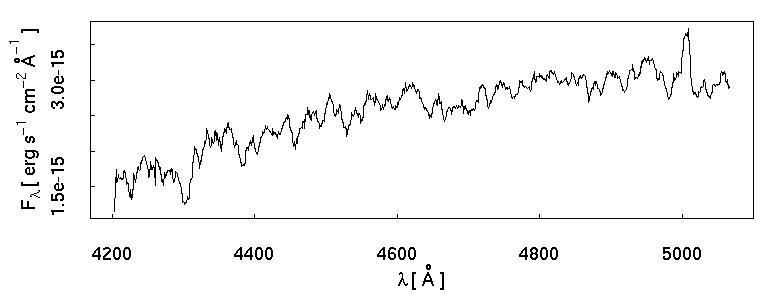
There are 5 spectra for this galaxy. Here is only the first, making it clearer on this page. This is Optical from the Nucleus region, using the Palomar 200m Telescope and its Double Spectrograph Instrument.
There is a metallic absorption line around 4300 A and a metallic emission line around 5000 A.
2.3.9 Image 9
click on link for image:
https://www.cosmologyview.com/NEDcap/NED-Overview-pics/NED-spec2.png
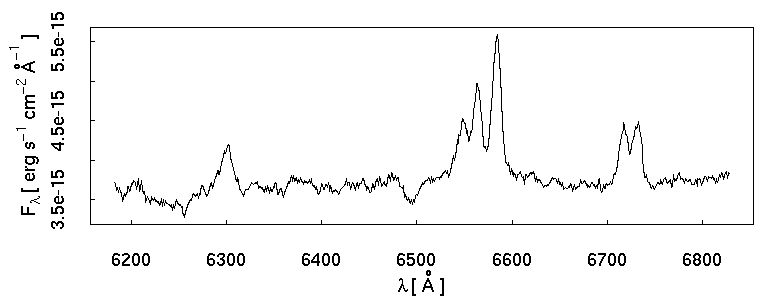
Here is only the second spectrum of the 5.
This is Optical from the Nucleus region, using the Palomar 200m Telescope and its Double Spectrograph Instrument.
There are metallic emission lines around 6300 A, 6570, and a pair around 6750 A.
2.3.10 Image 10
click on link for image:
https://www.cosmologyview.com/NEDcap/NED-Overview-pics/NED-spec3.png
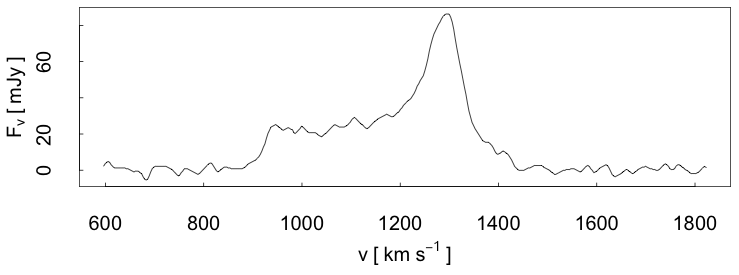
Here is only the third spectrum of the 5. This is the H I line from the Integrated Region using the Nancay Telescope and its Auto Correlator Spectrometer Instrument.
This is not a spectrum. Whatever spectrum was recorded, only a distribution of velocities is presented. This image offers no information of what was actually measured.
2.3.11 Image 11
click on link for image:
https://www.cosmologyview.com/NEDcap/NED-Overview-pics/NED-spec4.png
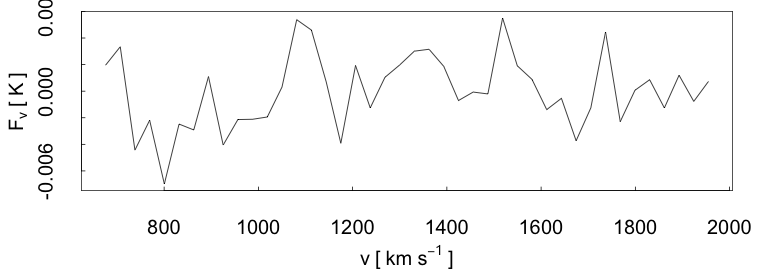
Here is only the fourth spectrum of the 5. This is the CO (1-0) line from the Integrated region using the IRAM Telescope and its ISIS Instrument.
This is not a spectrum. Whatever spectrum was recorded, only a distribution of velocities is presented. This image offers no information of what was measured for CO.
2.3.12 Image 12
click on link for image:
https://www.cosmologyview.com/NEDcap/NED-Overview-pics/NED-spec5.png
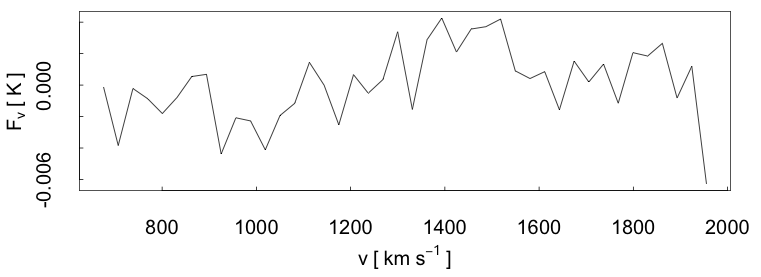
Here is only the last spectrum of the 5. This is the CO (2-1) line from the Integrated region using the IRAM Telescope and its ISIS Instrument.
This is not a spectrum. Whatever spectrum was recorded, only a distribution of velocities is presented. NED offers no information of what was measured for CO.
2.3.13 NGC 3226 Data observations
There are several important observations with only one galaxy, which is serving as an example.
1) The redshift velocity value does not identify its origin. It is probably from one of the emission lines. This galaxy has several candidates in the first 2 spectra for a selection.
This is negligence in NED data, when providing a value without identifying its evidence.
2) The neutral hydrogen line measurement is not provided. Instead, only a velocity is plotted with a distribution of intensity across a range of velocities.
If such a measurement is being used as the galaxy redshift velocity, despite there being no value of a measured change in a wavelength, it requires explicit definition of its uncertainty and margin of error. This not a bell curve suggesting probabilities. This is closer to a random distribution of possible values, coming from a cloud of neutral hydrogen atoms moving independently toward a massive galaxy. Astronomers pick one the values from the disorganized set of atoms and assign it to the large body behind the cloud. This assignment is a mistake and cannot be justified.
2) The CO line measurements have no basis, like from a certain spectrogram. Instead, only a velocity set is charted with a distribution of intensity across a range of velocities.
I found nothing in the NED site or in Wikipedia explaining a CO line.
There are 2 measurements of CO line, but they have different distributions, while having the same range on the X-axis.
Whatever this CO line is, it must be ignored because it is physically impossible to measure the 3-dimensional velocity of a galaxy using a line of sight measurement of an emission line. To measure the proper velocity of a planet, many observations over a period of time are required. The same requirement applies to a galaxy.
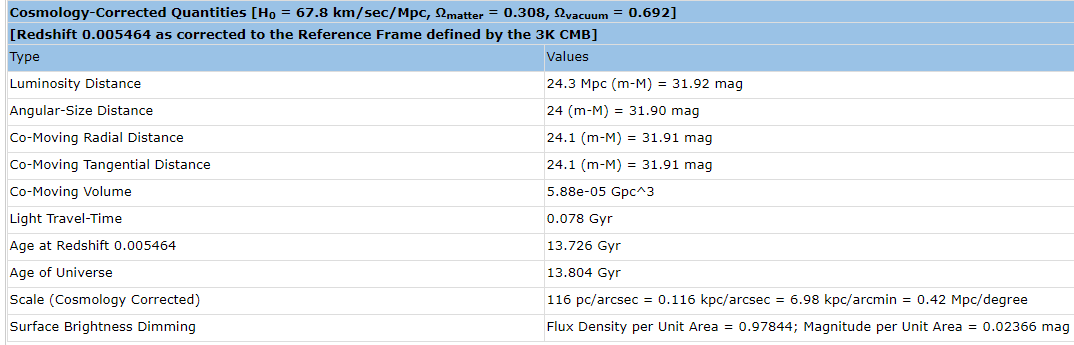
3) Using CMB
There is a notable line on the Redshifts page:
[Redshift 0.005464 as corrected to the Reference Frame defined by the 3K CMB]
There is no Cosmic Microwave Background (this mistake is explained in section Big Bang), so any "correction" is actually a "corruption" so the redshift must have the correction removed. In any case, the redshift and spectrum are from atoms, and are not valid.
2.4 Galaxy Data from both references
This reference file in .xls format is compressed in a .zip format for convenient distribution. [Reference:
https://www,cosmologyview.com/pdfs/Z-Galaxy--Data-WN.zip
The main worksheet, Galaxies, has over 1000 rows and over 70 columns. Compressing that content into a smaller page is impossible.
Many of the galaxies within our observable universe have a public position. Many, but not all, have a velocity (as km/s or z). Most of those also have a distance. Some have a size, measured in either light-years or arcseconds.
These data were compiled, when available, into this data set.
A diameter in lightyears is entered, and/or angular dimensions, depending on each galaxy's data. Sizes of galaxies are not used in this book, because I will not attempt to duplicate the algorithms which convert a magnitude and size into a luminosity and then to a distance.
The data are sorted in this order:
1) Sky quadrant, from NQ1 to SQ4,
2) Constellation by increasing Right Ascension,
3) Galaxy by increasing Right Ascension.
The Milky Way satellite galaxies are separated at the start of the list, as their close distances are unrelated to those of distant galaxies having nearby celestial coordinates.
The Magellanic Clouds are considered, in this data set, as Local Group galaxies. A study of groups of stars in both galaxies concluded their transverse velocity is too fast for them to be in orbit around the Milky Way. That conclusion takes them out of the list of Milky Way satellites which are assumed to be in orbit by gravity.
The most distant galaxies are at the end of the list, where they are sorted by coordinates. Most of them are in the distant background to nearer galaxies in the foreground. When all are sorted only by coordinates, then their correct relationship of foreground or background is not apparent.
The spreadsheet file has 2 worksheets:
1) Galaxies, with data for the over 600 galaxies and 24 Abell clusters.
Most of these clusters are very distant. To be included, the cluster must have a redshift value.
2) Cepheids, with the subset of 17 galaxies beyond our Local Group having a Cepheid.
The spreadsheet also has several charts, which are presented in this book.
The zip includes other files: 1) column definitions
2) TOC, which identifies by row number the respective quadrants in the long spreadsheet; this list is like a table of contents.
2.5 Constellation Data
Astronomers have defined a set of quadrants for the sky and assigned constellations to these quadrants.
I created a reference file for the constellations, including their abbreviation, and their quadrant and rough celestial coordinates.
The original was in Excel, but it is distributed in pdf. [Reference:
https://www,cosmologyview.com/pdfs/Z-Constellations.pdf
]
Go to Table of Contents, to read a specific section.
;ast update: 01/05/2022