Cosmology Views
One does not usually think of temperature as having a velocity but an astrophysicist can do just that, when making a mistake with a spectrum from a pulsating variable star.
This mistake is actually another wrong use of the Doppler effect. Galaxy red shifts are another.
First, here is the background and then the mistake.
A heat source generates thermal radiation.
from Wikipedia:
Thermal radiation is electromagnetic radiation generated by the thermal motion of particles in matter. All matter with a temperature greater than absolute zero emits thermal radiation. Particle motion results in charge-acceleration or dipole oscillation which produces electromagnetic radiation.
(excerpt end)
Wikipedia has a chart showing how the frequency or wavelength distribution changes by temperature.
If the heat source is moving then by the Doppler effect the entire spectrum would shift accordingly.
I cannot find the reference but I recall a web page remarked a temperature sensor monitoring a moving heat source will measure a temperature higher or lower depending on the object's direction of motion. Even without the reference this should be expected by the Doppler effect. The temperature sensor monitors the peak frequency to measure a temperature; if the peak shifts then the temperature shifts.
The user of such a device probably has a warning somewhere in the operator manual about the moving object, perhaps in the device's margin of error.
The sensor presents an uncertainty.
For the correct conclusion of either:
a) a change in actual temperature, or
b) an apparent change by the Doppler effect.
In most cases (like in a building on Earth) the motion will result in an undetectable change.
the spectrum must be checked to resolve this uncertainty if necessary.
For (a) the frequency distribution changed.
For (b) the frequency distribution is as expected but the entire spectrum shifted toward either the blue end (or warmer) or red end (or cooler).
Without the spectrum check, there are 2 possible mistakes:
1) the wrong temperature is recorded for the object.
2) the change (or shift) in the peak frequency is attributed to the object's velocity and direction, not to a change in temperature.
step (b) should prevent mistake (2).
Astrophysicists apparently can make mistake (2).
Here is the background for this mistake.
The star's photosphere is a source of thermal radiation so its spectrum has this distribution so that is used to measure the temperature of the photosphere.
Pulsating variable stars, like a Cepheid, have a luminosity curve. The star's brightness will follow a consistent brightening, then dimming, with this cycle repeating over a span of time.
Wikipedia has a plot image from the first Cepheid variable star.
The plot shows changes in magnitude compared to phase which represents a scaled time value. These stars have cycles spanning several days.
From Wikipedia (item numbers are inserted as<# > for convenient reference) :
From the [variable star] spectrum the following data are derived:
what kind of star is it: what is its temperature, its luminosity class (dwarf star, giant star, supergiant, etc.)? <1>
is it a single star, or a binary? (the combined spectrum of a binary star may show elements from the spectra of each of the member stars)
does the spectrum change with time? (for example, the star may turn hotter and cooler periodically) < 3>
changes in brightness may depend strongly on the part of the spectrum that is observed (for example, large variations in visible light but hardly any changes in the infrared)
if the wavelengths of spectral lines are shifted this points to movements (for example, a periodical swelling and shrinking of the star, or its rotation, or an expanding gas shell) (Doppler effect) <5>
strong magnetic fields on the star betray themselves in the spectrum
abnormal emission or absorption lines may be indication of a hot stellar atmosphere, or gas clouds surrounding the star. <7>
(excerpt end)
remark:
Items (1) and (3) recognize this is a spectrum for thermal radiation.
Item (5) notes the Doppler effect can shift some spectral lines so a shifted line comes from the expanding gas atoms (7) in motion.
subsequent excerpt:
Combining light curves with spectral data often gives a clue as to the changes that occur in a variable star. For example, evidence for a pulsating star is found in its shifting spectrum because its surface periodically moves toward and away from us, with the same frequency as its changing brightness.
(excerpt end)
remark:
The determination of whether " its surface periodically moves" depends on either:
a) whether the entire spectrum shifts due to light source in motion, which is the Doppler effect, or
b) whether only the frequency distribution changes which is a change in temperature.
To conclude (a) or (b) the particular spectrum is required for analysis.
Astronomers consistently do not publish spectra. This lack of data was the subject of a post on February 8, Galaxy Redshift Data Revelation.
Fortunately, there is a suitable sample published in the paper for the 2011 Nobel Prize in Physics.
On January 21, 2020 I posted Accelerating Expansion of the Universe Is Based on Mistakes
A figure in that paper about the false accelerating expansion is useful for this topic.
The study made the ridiculous mistake of treating the light curves from pulsating variable stars as from supernovae and reached the (remarkable?) conclusion the supernovae light curves were rather similar. Of course, as a collection of similar pulsating variable stars their light curves should be similar. With this mistake the authors concluded the supernovae were consistent. Within their document having many mistakes, they included the spectra to compare the red shifts of 2 supernova in their search for time dilation.
The figure is the comparison of spectra from 2 stars, even if it has another description in the paper.
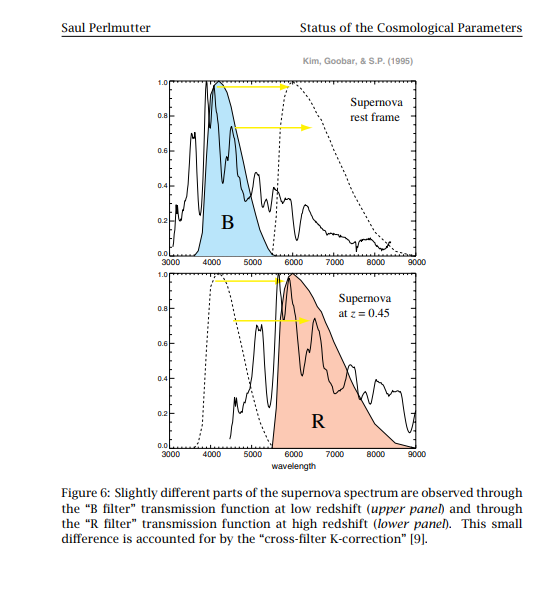
Here is Figure 6 from that document (which is linked in that post.
The figure shows 2 objects. The peak wavelength for object B is around 4000 Angstroms while R's peak is around 6000 A.
Using these rough values, the rough z value is 0.5; the figure shows 0.45 using better numbers.
The post notes the temperatures for the 4000A and 6000A are B = 7244 K and R = 4829K.
The astrophysicists involved in this study assigned a velocity (as a z value) to a temperature change!
The difference between the 2 is clearly only in the distribution because both have a similar decline at the right end where both have energy in the infrared range but different energies at the left end in the ultraviolet range (4000 A).
Conclusion:
Without spectra to analyze, the one sample reveals the problem of assigning a velocity to a temperature change.
The pulsating variable stars are in the instability strip in the H-R diagram, shown in the H-R image here.
The relationship between luminosity and thermal radiation suggest this occurs at the thermosphere. If the cycle involved something which gradually obscures and dissipates over much of the thermosphere then that would probably dim the intensity of the overall distribution but not the distribution. The spectrum sample suggests an actual cycle in temperature so the cycle must be internal.
Somehow the electric star has an oscillating temperature cycle. This suggests its energy supply from the galaxy is oscillating.
The behavior of a Cepheid is more complicated when including similar variable stars.
This makes the post longer...
from Wikipedia:
RR Lyrae variables are periodic variable stars, commonly found in globular clusters.
The RR Lyrae stars are conventionally divided into three main types, based on the shape of the stars' brightness curves:
RRab variables are the most common, making up 91% of all observed RR Lyrae, and display the steep rises in brightness typical of RR Lyrae
RRc are less common, making up 9% of observed RR Lyrae, and have shorter periods and more sinusoidal variation
RRd are rare, making up between <1% and 30% of RR Lyrae in a system, and are double-mode pulsators, unlike RRab and RRc
Distribution
RR Lyrae stars were formerly called "cluster variables" because of their strong (but not exclusive) association with globular clusters; conversely, over 80% of all variables known in globular clusters are RR Lyraes. RR Lyrae stars are found at all galactic latitudes, as opposed to classical Cepheids, which are strongly associated with the galactic plane.
Because of their old age, RR Lyraes are commonly used to trace certain populations in the Milky Way, including the halo and thick disk.
Several times as many RR Lyraes are known as all Cepheids combined; in the 1980s, about 1900 were known in globular clusters. Some estimates have about 85000 in the Milky Way.
Though binary star systems are common for typical stars, RR Lyrae are very rarely observed in pairs.
Unlike Cepheid variables, RR Lyrae variables do not follow a strict period-luminosity relationship at visual wavelengths, although they do in the infrared K band. They are normally analysed using a period-colour-relationship, for example using a Wesenheit function. In this way, they can be used as standard candles for distance measurements although there are difficulties with the effects of metallicity, faintness, and blending. The effect of blending can impact RR Lyrae variables sampled near the cores of globular clusters, which are so dense that in low-resolution observations multiple (unresolved) stars may appear as a single target. Thus the brightness measured for that seemingly single star (e.g., an RR Lyrae variable) is erroneously too bright, given those unresolved stars contributed to the brightness determined. Consequently, the computed distance is wrong, and certain researchers have argued that the blending effect can introduce a systematic uncertainty into the cosmic distance ladder, and may bias the estimated age of the Universe and the Hubble constant.
RR Lyrae stars were formerly called "cluster variables" because of their strong (but not exclusive) association with globular clusters; conversely, over 80% of all variables known in globular clusters are RR Lyraes. RR Lyrae stars are found at all galactic latitudes, as opposed to classical Cepheids, which are strongly associated with the galactic plane.
Because of their old age, RR Lyraes are commonly used to trace certain populations in the Milky Way, including the halo and thick disk.
Several times as many RR Lyraes are known as all Cepheids combined; in the 1980s, about 1900 were known in globular clusters. Some estimates have about 85000 in the Milky Way.
Though binary star systems are common for typical stars, RR Lyrae are very rarely observed in pairs.
(excerpt end)
remarks:
This star type was also in the H-R diagram above.
Lyrae stars outnumber the Cepheids who are brighter but cooler. The instability strip is roughly perpendicular to the main sequence curve, which, by itself, suggests these stars deviate in behaviors from "typical" stars.
A notable observation: RR Lyrae stars "may bias the estimated age of the Universe and the Hubble constant."
The RR Lyrae behaviors emphasize the context of a variable star, whether in a globular cluster or in the galactic plane.
A globular cluster has noted variations including:
"91% of all observed RR Lyrae display the steep rises in brightness typical of RR Lyrae" while
"9% of observed RR Lyrae have shorter periods and more sinusoidal variation."
The electrical environment for a star is certainly different in the arms of a spiral galaxy plane for the Cepheids than in a packed globular cluster whose stars are the hottest types.
in popular cosmology, the the entire pulsating star is expanding and contracting driven by pressure changes from internal cycles involving negative hydrogen ions and helium ionization.
This rough explanation for a pulsating variable star conforms to the EU paradigm; gravity has no effect.
Pulsating stars are clearly critical in cosmology, even affecting the Hubble constant.